
Quality of data is a crucial factor, on which depends the success of all ventures and projects based on data. Effective optimisation and diagnosis of infrastructure demand correct information from processes and devices. It doesn’t come as a surprise that people responsible for data science use 80% of their time just for preparing the data.
Smart validation is necessary to achieve satisfying data quality. Smart doesn’t automatically mean the usage of advanced machine learning algorithms. Firstly you should try to use arithmetic methods: mathematical, physical and chemical formulas and industry knowledge.
Smart validation doesn’t automatically mean the usage of advanced machine learning algorithms. Start with physical, mathematical.
This task requires proper tools such as cloud analysis programs. The chosen analytical tool should be designed for time-series data (many readings from a single device), enable usage of various algorithms from simple calculations to advanced statistical methods and be intuitive and scalable. It is worth noticing that popular Excel doesn’t meet these conditions. Among our solutions, we offer Smart RDM Data Science Platform in Azure cloud and partner’s tool Seeq.
Where do data errors come from?
There are a few causes of bad quality data. Among them we can list improperly executed software installations, that result in errors or inadequate handling of some events, e.g. wrong configuration of DCS/SCADA system.
Another cause may be problems at a systemic level. When the source of data is a telemetric system, then readings are taken from real devices. Devices, as we know, like to break, so often errors develop already during the measurement stage or while transmitting value. Common occurrences are, for example, transmission errors, data gaps and incorrect values — reading anomalies. Sensors can get damaged, which results in the reception of absurd values.
The data transmission system can also be damaged itself, if it was incorrectly scaled or in which a device was replaced. Another cause of bad quality is a change in data format, that influence sources or target data warehouses.
Stages of data clarification
Collection of comprehensive data is impossible, so how we can clarify the data, so it won’t lead us to false interpretations and conclusions? We need to go through the process of data clarification:
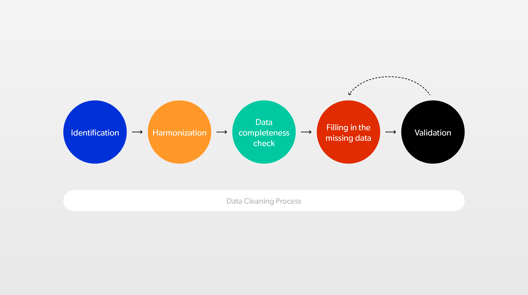
1. Identification — we want to know precisely, which data comes from what device. For example, one substation can have five temperature meters and two flow measurement sensors. We cannot randomly use data provided by the fourth meter if we needed records from the first meter. We need to know, which is which. To achieve this, we attribute data to devices, so it is possible to identify them correctly. We organise it in a tree structure.
2. Harmonisation — devices from different manufacturers use different encoding, ways of transmitting data or even units. The goal of harmonisation is bringing all data to a common format and introducing nomenclature based on normalised encoding system.
3. Data completeness verification — we need to make sure what parts of data are missing and why. There is no point in estimating readings for a device, which in a given moment was intentionally turned off, for example, to undergo maintenance. Identified data gaps that require filling are estimated in the next steps of the process.
4. Filling missing data — to achieve this, we may use different methods: starting with arithmetic, through statistical, to machine learning.
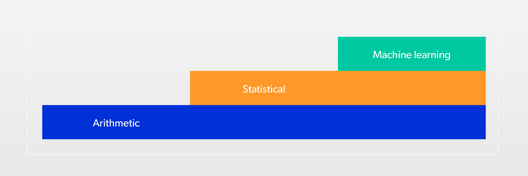
In the case of the arithmetic methods, we calculate missing data based on remaining data using simple mathematical operations, physics equations etc. We can also use linear approximation, where we connect dot-to-dot the last data we had, with the first that appears. Using linear approximation is simplest, alas it often leads to errors.
That is why statistical methods are popular. We calculate what values theoretically should occur in a given place using historical data and advanced mathematic modelling. These methods are particularly useful in case of phenomenons, which we aren’t able to describe with arithmetic formulas. For example, we can use it when we want to find dependency between the wind’s velocity and vibrations of a turbine that is placed on a wind farm in proximity to other turbines. Then factors such as the direction of the wind gain significance because turbines obstruct each other and disrupt the wind flow.
Finally, we can use machine learning models. These models learn how devices behave typically based on historical data. Based on events analysis, that occurred in history, the model tries to foresee how machine acted in periods, where there are data gaps. There are many algorithms that you can use that are already prepared or create your own.
There also exists an alternative method: surroundings analysis. In a given location, we can use data from adjacent and similar devices. For example, when we know, that the buildings stand next to each other, we don’t have to calculate the ambient temperature statistically — we need to “take a peek at our neighbour”. We build a logic based on a system, that will calculate parameters based on the behaviour of a whole family of similar objects in direct proximity. This is the most advanced approach.
At this stage, we have a complete signal. In the next steps, we will check it’s correctness.
5. Validation — among our data, there might be false values. This data is technically correct but doesn’t fit logically. For example, we know that the reading of temperature outside in winter in London cannot be 120 degrees Celsius.
Here, again, firstly we use mathematics to determine validation rules like we agree, that the temperature outside must be between -50 and +50 degrees Celsius. We add a rule that data outside this scope are incorrect.
Here, again, firstly we use mathematics to determine validation rules like we agree, that the temperature outside must be between -50 and +50 degrees Celsius. We add a rule that data outside this scope are incorrect.
Now it is us who create gaps, that we will later fill. We check, if data is in a reasonable scope, or if values don’t change too quickly. All data outside the range we consider incorrect.
Furthermore, we can use physics or chemical models to exclude incorrect values. We input data into the equations, and we delete ones, that don’t give correct outcomes. Later, to supplement these values, we repeat the step with filing data. Depending on the complexity of data and dependencies, we use mathematics, statistics and machine learning.
In validation, we also use industry knowledge to accurately model the behaviour of a given device. For example, meters have specified maximal range, after which they turn to zero and start counting again. Thanks to experts knowledge, we can set a validation rule, that searches for such “turns” and lets correctly track the data growth.
After completing all these steps, we get a clear signal. Our correct data now lets us build advanced models based on sophisticated analysis such as predictive maintenance, for example, to reliably forecast energy demand or current diagnostics of the device’s operation.
Historical data
With mathematical and physics models, we don’t need a history of measurements to do calculations. But in the case of statistics and machine learning, historical data is necessary. The more past values we have, the more efficient our validation will be.
Learning models aren’t foolproof; that is why they are best used as supporting, not decisive systems. However, the more historical data such a system will ingest, the more reliable and precise it will be.
To process historical data in the context of validation, you need dedicated solutions such as Smartvee or Seeq, which are prepared to analyse time-series data and let use analyses on the various complexity level.
Why isn’t machine learning the primary method?
Machine learning won’t substitute thermodynamics, physics or mathematics. It is essential to get a good understanding of a phenomenon, which we model. The building of a system should begin with a description of known events with, what we know from chemistry, physics, biology and other branches of science. Only after this, we can include machine learning algorithms.
Machine learning won’t substitute thermodynamics, physics or mathematics.
To achieve this, we start with business workshops with teams that deal with infrastructure and devices daily. At the workshop, we can revive together the data, assess what phenomenons occur and ask for causes of anomalies. We include engineers, data sciences, business owners and subject matter experts with technical knowledge.
The algorithm doesn’t always do well with new problems. That is why learning models should focus on modelling things, that we can’t describe with equations. With less complicated processes, these methods are sub-optimal.
Effects of data validation
Clarified data is an excellent basis to do further analyses, like a prediction of energy production, usage of resources or planning maintenance. Unfortunately, some companies try to skip the step of data preparation and jump right into analysis. Remember that you can’t prepare a reliable analysis without good quality data.
In ConnectPoint, we offer the complete solution: from gathering data to advanced analysis. We build comprehensive Data Repository that identifies and harmonise data. Then we subsequently build analytical layers on it, that are best suited for our customers’ needs. Write to us to learn more about how can you better the data usage in your organisation.
